


Can the Rockies be Profitable Despite Worst MLB Record in History?
We live in a society where you are rewarded for success. If you do something outstanding at your job, then you usually make more money. This is not always the case in the sports world.
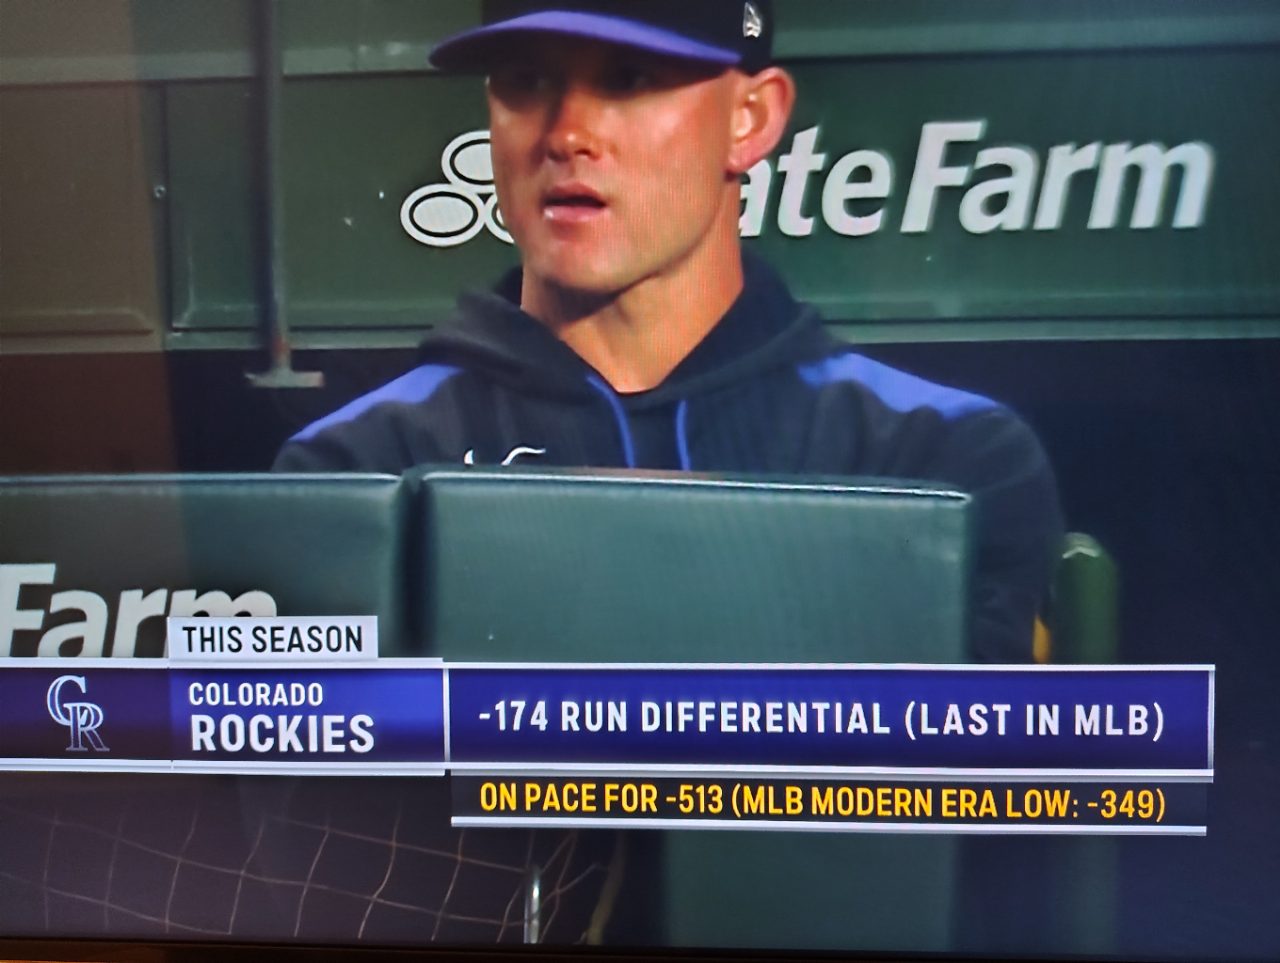
Case in point, the 2025 Colorado Rockies are off to the worst start in MLB’s modern era. They went 8-42 in their first 50 games. They are straight up terrible. But they may still very well they will end up profitable when the book closes on the 2025 season. How is this possible?
The Rockies have a unique situation where their home field is in a beautiful setting, gets a ton of tourists, and is hitter-friendly (which means more home runs and a higher entertainment value). People seem to come out to the games regardless of what product they put on the field.
In 2023, the Rockies had a finishing record of 59-103. The team managed to pull in $313 in revenue from a combination of tickets sales, concessions, media deals and apparel sales. Of course, revenue isn’t what the team pulled in as profit. Net profit/loss is estimated to only be about negative $14M-$17M when all the bills were paid. Players, employees, and vendors are all able to earn a living despite the team being bad. But ownership took a bit of a hit.
In 2023, the Rockies averaged a home attendance of about 32,000 fans per game. This is quite remarkable for a 100-loss team. Heading into 2025 the team announced plans to scale back payroll. The effect has been clear. The Rockies are the worst team baseball fans have seen in the modern era (since 1901).
The Rockies lost some media revenue when AT&T Sportsnet decided to get out of the industry. They were able to get a new TV carrier but for less money. Team profits have been near the breakeven point for the last four seasons and ownership is looking for a change. What is the point of running a business unless you are making money?
Attendance is down this season to about 25,000 heads per home game. This is significant downturn. However, they trimmed player payroll from $171M in 2023 (same # in 2024) to just $125M this year. There is still the possibility the team can turn a small profit when the season comes to an end. It’s important to note that some teams report huge losses despite being in major markets. An example of this are the 2022 Mets, which lost $138.5M.
Conclusion
The Rockies have a low payroll of only $125M but they still put 25,000 people in the stands for home games. With some careful management, the team could end up ever so slightly profitable.
Despite having one of the best baseball destinations to have ever existed, the Rockies operate close to break even on a yearly basis. The only way to turn this team seriously profitable again is to start winning games. Their home field seats 50,000 fans. They need to put 40,000-50,000 butts in the seats every game to start making big money. Starting 8-42 and having the worst record in modern baseball history is not going to put the team in the black.
Worst MLB Starts in MLB Modern Era
Here is a list of the top 10 worst MLB team starts through the first 50 games in the modern era (since 1901), based on win-loss records and winning percentage, compiled from available data:
2025 Colorado Rockies: 8-42 (.160)
Set the modern-era record for the worst 50-game start after a 9-5 loss to the Phillies. They had a -148 run differential and were on pace for 136 losses, surpassing the 1899 Cleveland Spiders’ 134 losses.
1932 Boston Red Sox: 10-40 (.200)
Tied with the 2023 A’s for the worst 50-game start in AL/NL history at the time. They finished 43-111 (.279), with a poor offense and pitching staff contributing to a dismal season.
2023 Oakland Athletics: 10-40 (.200)
Matched the 1932 Red Sox with a 10-40 start, marked by a -178 run differential, the worst through 50 games since 1901. Their 6.95 ERA was among the highest, finishing 50-112 (.309).
1996 Detroit Tigers: 12-38 (.240)
A historically bad pitching staff with a 7.13 ERA and 1.81 WHIP led to this poor start. The team finished 53-109 (.327), struggling offensively and defensively.
1911 Boston Rustlers: 13-37 (.260)
Predecessor to the Braves, they had a weak lineup and pitching, finishing 44-107 (.291). Their early struggles were indicative of a franchise in decline.
2001 Tampa Bay Devil Rays: 14-36 (.280)
An expansion team still finding its footing, they allowed 6.2 runs per game while scoring only 3.8, finishing 62-100 (.383).
1988 Baltimore Orioles: 11-39 (.220)
Started with an MLB-record 21-game losing streak, going 0-21 before their first win. They finished 54-107 (.335), with poor pitching and offense.
2003 Detroit Tigers: 14-36 (.280)
Known for one of the worst seasons in modern history, they finished 43-119 (.265). Their offense hit .183 with a .256 slugging percentage early on.
1962 New York Mets: 14-36 (.280)
An expansion team, they became infamous for their futility, finishing 40-120 (.250). Their pitching and offense were overmatched in their debut season.
1995 Florida Marlins: 15-35 (.300)
In their third season, impacted by the MLB strike, they started 5-20 and finished 67-76 (.469), showing improvement later but struggling early.
Notes
Pre-Modern Era: The 1895 Louisville Colonels hold the all-time worst start at 7-43 (.140), but this is outside the modern era (post-1901).
Run Differential: The 2023 A’s (-178) and 2025 Rockies (-148) had the worst run differentials through 50 games, highlighting their struggles.
Many of these teams were either expansion franchises (e.g., 2001 Devil Rays, 1962 Mets), in rebuilding phases (e.g., 2003 Tigers), or faced unique challenges like roster gutting (e.g., 1988 Orioles).
Data is sourced from MLB.com, ESPN, and other baseball statistics sites, with updates through May 2025. This list focuses on modern-era teams with the lowest winning percentages through 50 games, as earlier eras had shorter schedules and different competitive dynamics. For further details, you can check MLB.com or ESPN’s historical records.
For More Baseball News click here