


The Worst Team in Major League Baseball History?
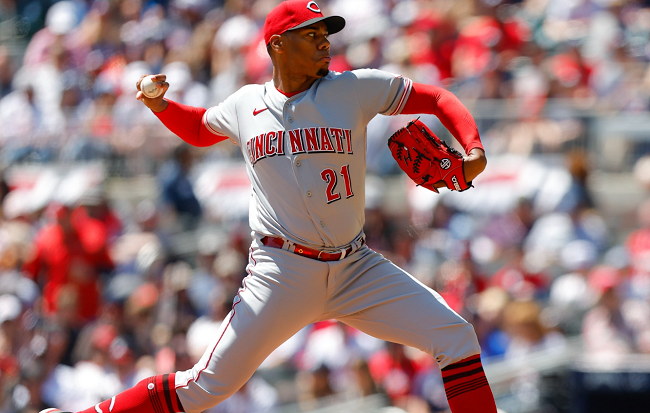
The Cincinnati Reds started the 2022 MLB season with a win over the defending World Series champion Atlanta Braves. The Reds 22-year-old pitching prospect Hunter Greene and his 100 mph heater tamed the Braves through five innings and Cincinnati won 6-3. The Reds would split four games with Atlanta, which was impressive considering Cincy lost a large part of its Wild Card team from a year ago.
Sonny Gray, Eugenio Suarez, and Jesse Winker were all traded and Nick Castellanos left in free agency. The Reds picked up lefty Mike Minor and OF Tommy Pham in the offseason. They still had former MVP Joey Votto, the reigning NL Rookie of the Year in Jonathan India, and two decent pitchers in Tyler Mahle and Luis Castillo. With some young pitchers like Greene and Nick Lodolo, the Reds were probably not going to get back to the playoffs. But, they could at least be competitive, right?
The Reds’ Peril
Well, not exactly. After the 2-2 start, the Reds lost 19 of their next 20 games. Only one of those games was a one-run loss. Seven of the 19 losses came by at least five runs. Remember Greene? After his season-opening win, the young Reds pitcher is now 1-5. His ERA has ballooned to 7.62. In his fifth start of the season, Greene gave up five home runs. Yes, that was in one game. He has now served up 11 dingers for the season.
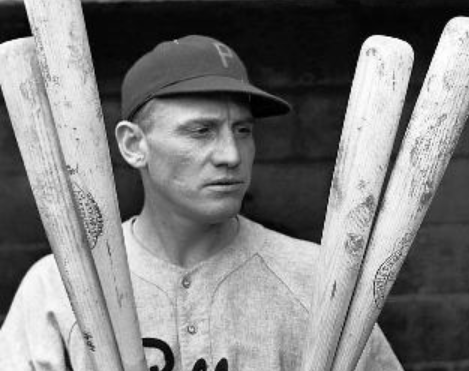
Phillies 1930
The Reds pitching is awful. Currently, the team’s ERA is 6.40. The next worst team, Pittsburgh, has an ERA of 4.78. If the Reds continue on this pace, their team ERA will be the worst since the Philadelphia Phillies of 1930. To further drill in how bad Cincy’s pitching is, teams in the NL in 1930 hit over .300. This year’s NL is batting a collective .236.
Cincinnati is 30th in opponent runs per game allowing 6.25. They are also dead last in opponent OPS (.850) and they rank 29th in opponent batting average allowing hitters to bat .275. Another of the Reds’ problems is that they don’t hit all that well either. While they are a middle of the pack team in runs scored, Cincy is 22nd in homers per game, 23rd in OPS (.644), and 27th in team batting average (.218).
Record Pace
Prior to playing on Friday, May 13, the Reds were 8-24 for a winning percentage of .250. In their two previous series, the Reds somehow managed to beat NL Central leader Milwaukee in two of three games and then beat the equally bad Pittsburgh Pirates in two of three. The Reds have won five of their last seven games, which means not long ago they were 3-20. That’s a winning percentage of .130.
Historically, the worst winning percentage in MLB history was the 1916 Athletics which went 36-117 (.235). Of the top five worst winning percentages in MLB history, the most recent was the 1962 Mets who went 40-120 (.250) in their first season in the majors. At their current pace, Cincinnati would lose 122 games and would break the franchise record for futility. The worst Reds team was the 1934 edition which finished 52-99 (.344).

Even Worse
After winning 83 games last year, the Reds Over/Under number for win totals was 73.5. As mentioned, if the Reds maintain their current pace, they will finish with a record of 40-122. The team’s World Series odds just shifted and the Reds are now the longest shot to win it all. They shared that spot with Baltimore until recently when the Reds World Series odds moved to +120000 at online sportsbooks.
And, it could be even worse. If the Reds do indeed end up with the worst record in MLB in 2022, they won’t even secure the No. 1 pick in the next MLB draft. The league is going to a lottery system with each of the 18 teams that don’t make the postseason having a shot at the No. 1 pick. If the Reds finish worst in MLB this year, they will have a 16.5 percent chance of getting the No. 1 pick next year.
Anyway, here is a list of the top 25 worst MLB teams in history.
Worst MLB Teams by Win %
| Team | Year | Record |
|---|---|---|
| Philadelphia Athletics | 1916 | 36-117 |
| Boston Braves | 1935 | 38-115 |
| New York Mets | 1962 | 40-120 |
| Philadelphia Athletics | 1919 | 36-104 |
| Detroit Tigers | 2003 | 43-119 |
| Pittsburgh Pirates | 1952 | 42-112 |
| Washington Senators | 1909 | 42-110 |
| Philadelphia Phillies | 1942 | 42-109 |
| Philadelphia Phillies | 1941 | 43-111 |
| St. Louis Browns | 1939 | 43-111 |
| Boston Red Sox | 1932 | 43-111 |
| Philadelphia Phillies | 1928 | 43-109 |
| Philadelphia Athletics | 1915 | 43-109 |
| Baltimore Orioles | 2018 | 47-115 |
| Boston Rustlers | 1911 | 44-107 |
| Detroit Tigers | 2019 | 47-114 |
| Boston Doves | 1909 | 45-108 |
| St. Louis Browns | 1911 | 45-107 |
| Philadelphia Phillies | 1939 | 45-106 |
| Philadelphia Phillies | 1945 | 46-108 |
| St. Louis Browns | 1937 | 46-108 |
| Philadelphia Phillies | 1938 | 45-105 |
| Boston Red Sox | 1926 | 46-107 |
| Philadelphia Phillies | 1961 | 47-107 |